Intracranial Pressure and Intracranial Compliance
Intracranial pressure emerges from the interaction of tissue, blood, cerebrospinal fluid, and the boundaries surrounding them. Its significance depends on where it is measured, how the system accommodates changing volume, and what happens to tissue deformation and perfusion. A pressure value, a pressure waveform, and a pressure–volume relationship answer related but different questions.
58.1 The Skull Constrains a Connected, Living System
In the adult with an intact skull, the cranial cavity provides a relatively fixed enclosure over the timescale of acute illness. Brain tissue, intracranial blood, and cerebrospinal fluid, or CSF, occupy most of that enclosure. A hematoma, expanding tissue water, or additional vascular volume must therefore be accommodated by displacement, deformation, or an increase in pressure.
The Monro–Kellie principle expresses this volume constraint. It does not imply that all components are rigid or that their volumes remain independently fixed. Venous blood can leave, CSF can redistribute, and tissue can change shape. The clinical question is how much accommodation remains and what pressure change accompanies the next disturbance.
The cranial cavity also communicates with the spinal CSF space. Displacement into that connected space can contribute to craniospinal accommodation. In anesthetized, ventilated cats, Marmarou and colleagues separated cerebral and spinal compartments experimentally and demonstrated contributions from both to total compliance. Their measured distribution belongs to that preparation; it is not a fixed percentage to assign to every patient. 1
A decompressive skull defect changes the mechanical boundary by allowing outward displacement. An open fontanelle likewise changes the relationship between volume and pressure. Neither situation abolishes tissue swelling, local distortion, or the possibility of dangerous gradients. Comparing pressure–volume behavior across an intact skull and an open cranial boundary requires recognizing that they are different mechanical systems.
Intracranial contents are also continuously exchanging volume. Each cardiac cycle brings pulsatile arterial inflow and venous outflow, while respiration and posture alter venous and CSF conditions. A mean pressure represents an average across these moving processes. The system can be near volume equilibrium while substantial flows continue through it.
Thus, a fixed enclosure does not mean a static compartment. It means that changes in one component must be balanced by changes elsewhere or expressed as increasing pressure and deformation.
58.2 Pressure Requires a Location and a Reference
Intracranial pressure, or ICP, is a pressure measured at a particular location. Ventricular fluid pressure and local intraparenchymal pressure may track each other closely when compartments communicate freely and tissue forces are relatively uniform. That agreement is a physiological condition, not part of the definition of ICP.
Clinical values are usually expressed in millimeters of mercury, or mmHg, relative to atmospheric pressure. A fluid-filled ventricular system connects intracranial fluid to an external transducer through tubing. Its displayed pressure depends on both the ventricular pressure and the vertical position of the transducer relative to the chosen anatomical reference.
The hydrostatic contribution is determined by fluid density, gravitational acceleration, and vertical height. For a water-like fluid, 1 cm of vertical height corresponds to approximately 0.736 mmHg. Consider an illustrative measurement in which a transducer is inadvertently 10 cm below its intended reference. The added fluid-column pressure is approximately 10 × 0.736 = 7.36 mmHg. A true pressure of 15 mmHg at the reference would then be displayed near 22.4 mmHg, assuming an otherwise functioning static fluid column.
This calculation describes measurement error, not a drainage instruction. A transducer placed above the reference produces the opposite error. Zeroing to atmosphere establishes the instrument baseline; leveling establishes the relevant hydrostatic relationship. One does not substitute for the other.
In a clinical comparison of internal and external transducers connected to the same ventricular source, Darrow and colleagues found that occasional shifts in external zero-level positioning were a major source of disagreement. The study supports checking reference conditions before interpreting a numerical change as disease progression. 2
For a catheter-tip tissue sensor, the sensing element is inside the head, so external tubing height does not create the same fluid-column error. Its position, calibration, and possible baseline drift still matter. Every reported ICP should therefore be understood together with the measurement site, reference, device, and patient position.
58.3 Compensatory Reserve Is Different from the Current Pressure
Early in an expanding intracranial process, additional volume can be offset by displacement of CSF and venous blood. Pressure may change little even though the system has already used part of its available accommodation. Continued expansion progressively reduces that reserve.
This explains why a modest ICP cannot, by itself, certify that further volume will be well tolerated. Two patients with the same pressure can occupy different mechanical states. One may have substantial remaining displacement capacity; the other may be close to a region where a small additional volume causes a large pressure rise.
Reserve depends on accessibility as well as quantity. CSF located behind an obstructed pathway cannot necessarily redistribute into another space when needed. A distensible venous compartment cannot provide the same accommodation when venous outflow is impeded. The presence of visible fluid or blood volume does not establish how readily it can be displaced.
The speed of a disturbance also matters. Rapid pulsatile volume changes are accommodated through a different mixture of displacement and deformation than changes sustained long enough for additional CSF outflow or vascular adjustment. An estimate obtained during one timescale should not be transferred automatically to another.
A useful distinction is between storage and steady-state disposal. Compliance describes volume accommodation for a pressure change. Resistance to CSF outflow describes the pressure difference required to sustain a flow through an outflow pathway. Poor outflow can raise the equilibrium pressure even when the immediate pressure–volume response remains relatively compliant. Conversely, reduced compliance can amplify transient pressure changes without independently specifying the long-term equilibrium.
Marmarou's nonlinear model explicitly separated compliance, venous reference pressure, CSF absorption resistance, and formation. Testing in adult cats supported the importance of distinguishing transient pressure responses from the factors governing equilibrium. The full CSF transport system is developed in Chapter 61. 3
Compensatory reserve is consequently a property of the connected system under particular conditions. It cannot be read directly from one pressure, one anatomical volume, or one CT image.
58.4 Compliance and Elastance Describe Opposite Slopes
Compliance describes the volume change associated with a pressure change. Elastance describes the pressure change associated with a volume change. For a local pressure–volume relationship, the differential definitions are:
Here, C is compliance in mL/mmHg, E is elastance in mmHg/mL, V is the relevant volume in mL, and P is pressure in mmHg. The derivative denotes a local slope around the current operating point. The reciprocal relation applies when both quantities describe the same system, conditions, and timescale.
High compliance means that a given small volume change produces relatively little pressure change. High elastance means that the same volume change produces a larger pressure change. The words should not be interchanged: a less compliant intracranial system has greater elastance under the same conditions.
For an abstract finite-change example, suppose a modeled net volume increase of 1 mL accompanies a pressure increase from 15 to 20 mmHg. The pressure change is 5 mmHg. The average compliance over that interval is approximately 1 ÷ 5 = 0.20 mL/mmHg, and average elastance is 5 ÷ 1 = 5 mmHg/mL.
Those values describe the chosen interval, not necessarily the exact local slope at either endpoint. They are not an instruction to inject fluid, a safe test volume, or a patient reference range. A real intervention also permits CSF movement, vascular responses, and time-dependent relaxation; attributing its entire pressure response to a single passive material property may be wrong.
Intracranial compliance should also be distinguished from brain tissue material compliance. The former includes the behavior of vascular and CSF compartments and their connections. A tissue's intrinsic stiffness can contribute, but system compliance is not simply a bedside measurement of tissue consistency.
Similarly, low compliance does not mean zero capacity for deformation. It means that additional volume is associated with a larger pressure change. Tissue displacement and injury may continue even as the available low-pressure accommodation becomes limited.
58.5 Nonlinearity Makes the Operating Point Important
A pressure–volume curve can become progressively steeper as accommodation is exhausted. The same added volume then produces a larger pressure increment at a higher operating pressure. This behavior is often represented with an exponential model rather than a single constant compliance.
One illustrative form is:
P is modeled pressure in mmHg, P₀ is the reference pressure in mmHg, and ΔV is net modeled volume change in mL. The pressure–volume index, PVI, is the modeled volume associated with a tenfold pressure increase. It has units of mL and is not itself compliance. The second expression is the local compliance obtained by differentiating this specific curve; ln(10) is approximately 2.303.
Assume, solely for illustration, P₀ = 10 mmHg and PVI = 20 mL. A modeled net increase of 5 mL gives P = 10 × 10^(5/20) ≈ 17.8 mmHg. A further 5 mL, making ΔV = 10 mL, gives P ≈ 31.6 mmHg. Equal volume increments have produced pressure increments of approximately 7.8 and 13.8 mmHg.
At 10 mmHg, the modeled local compliance is 20 ÷ (2.303 × 10) ≈ 0.87 mL/mmHg. At 31.6 mmHg it is approximately 0.27 mL/mmHg. The pressure–volume index has remained constant, while local compliance has fallen because the operating point moved along the curve.
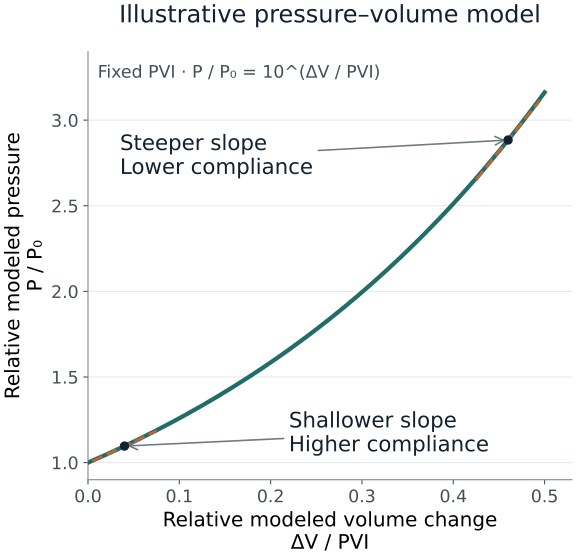
The exponential formulation and PVI arose from experimental pressure–volume modeling. Its value is explanatory: it makes the distinction between curve shape and current operating point explicit. 3
These assumed values are neither patient data nor injection volumes. The model omits changing venous pressure, active vascular responses, regional gradients, and altered skull boundaries. A fitted curve can also depend on the pressure reference and modeling choices. Actual deterioration need not follow this one mathematical trajectory, and the example cannot identify a volume that is safe to add or remove.
58.6 Blood Volume Couples Pressure to Vascular Physiology
Intracranial blood volume is one component of intracranial volume. Cerebral blood flow is a rate of blood passage through tissue. The two are related through vascular geometry and transit, but they are not interchangeable. Flow can change without a proportional volume change, and increased vascular volume does not guarantee adequate tissue perfusion.
Arteriolar dilation can increase vascular volume while reducing resistance. Carbon dioxide and the associated local chemical environment influence this tone, as do metabolic demand and autoregulatory responses. When reserve is limited, a vascular volume change that previously had little pressure effect can cause a substantial ICP increase.
The resulting feedback can become important. If a rise in ICP reduces the effective perfusion pressure, a functioning autoregulatory response may dilate resistance vessels. The accompanying volume increase can further raise ICP and reduce perfusion pressure. This is a conditional mechanism: it requires particular vascular responsiveness and pressure–volume conditions. It does not mean that every ICP rise initiates the same cascade.
Conversely, vasoconstriction can reduce blood volume and ICP while also reducing flow. A lower pressure after a change in carbon dioxide therefore does not establish improved oxygen delivery. Chapter 59 develops pressure–flow regulation, and Chapter 60 addresses delivery and metabolism.
Venous blood contributes through a different route. An increase in downstream venous pressure, obstruction of drainage, or reduced venous transmural distending pressure can change venous volume and pressure transmission. Collapsible outflow segments make these relations nonlinear; central venous pressure cannot simply be subtracted from ICP using a universal correction.
These mechanisms also explain why an ICP response is not a unique diagnostic signature. The same rise could involve tissue swelling, vascular dilation, venous congestion, or restricted CSF movement. Its timing relative to arterial pressure, carbon dioxide, ventilation, examination, and imaging helps distinguish the possibilities.
58.7 Compartments Permit Gradients and Tissue Displacement
Pressure tends to equilibrate within freely communicating fluid spaces. The injured intracranial system may not meet that condition. Mass lesions, compressed pathways, tissue deformation, and dural partitions can create regional differences in pressure and mechanical stress.
The falx and tentorium constrain movement without making every compartment mechanically independent. An expanding process can displace tissue toward a region of lower pressure, deform vessels, and distort structures near rigid boundaries. Herniation describes pathological tissue displacement; it cannot be reduced to crossing one global numerical ICP threshold.
A local sensor may consequently provide a technically accurate pressure that incompletely represents the region at greatest risk. In a small clinical series, Slavin and Misra simultaneously recorded ventricular and cerebellar pressures in five patients with posterior fossa disease and found differences that changed over time. The series demonstrates the possibility of clinically relevant compartment behavior, not a rule that every patient requires multiple sensors. 4
The distinction between pressure and stress is useful here. A fluid pressure is approximately isotropic at a point: it acts in all directions. Brain tissue can also sustain shear and directional deformation. A single scalar pressure does not describe the entire stress field, degree of axonal distortion, or local vascular compression.
Thus, an apparently reassuring supratentorial pressure does not exclude posterior fossa compression or another focal process. Conversely, a high measured pressure does not reveal where the principal distortion lies. Imaging and examination supply spatial information that a single monitor cannot provide.
The same caution applies when considering pressure communication through the craniospinal axis. A lumbar fluid pressure can represent the connected system only under appropriate anatomical and physiological conditions. The existence of a fluid connection does not establish that pressure is uniform in a patient with obstructed pathways or a mass lesion.
Interpreting ICP therefore requires both a volume–pressure model and a map of the patient's anatomy. Whole-system averages cannot replace recognition of local mechanical disease.
58.8 Posture and Extracranial Pressures Change the Boundary Conditions
Changing head or body position can alter both the measured hydrostatic relationship and the patient's actual intracranial physiology. These effects must be separated. Correcting an external transducer's height addresses measurement reference; it does not eliminate physiological changes in venous drainage or arterial pressure at the head.
Elevation can facilitate venous drainage under some conditions while reducing arterial pressure at brain level. Neck rotation, tight external compression, or unfavorable thoracic and abdominal pressures can impede drainage. The response depends on venous pathways, circulating volume, vascular tone, and the pressure–volume reserve available at that moment.
Feldman and colleagues studied 22 head-injured patients at horizontal and elevated head positions. Mean ICP and carotid pressure fell with elevation, while group cerebral blood flow and calculated perfusion pressure did not change significantly. This illustrates simultaneous effects on inflow pressure and outflow conditions; it does not establish an angle that optimizes physiology for every patient. 5
Positive intrathoracic pressure can affect cerebral venous drainage, but its intracranial consequences are not determined by the airway pressure alone. Transmission to pleural pressure depends on respiratory mechanics. Effects on cardiac output and arterial pressure, changes in carbon dioxide, and the state of venous outflow can contribute in different directions.
Spontaneous inspiratory effort introduces further variation through swings in thoracic pressure and venous return. Coughing or straining can produce brief increases in venous and intracranial pressure. The magnitude and persistence of the response depend partly on reserve and cannot be interpreted from peak pressure alone.
The useful observation is the coordinated change: what happened to the verified ICP signal, arterial pressure referenced appropriately for cerebral interpretation, ventilation, and neurological state? A change following position or ventilation is evidence of a response under those conditions, not proof of a fixed causal coefficient.
These links establish why the brain cannot be interpreted independently of the chest and circulation. Their detailed clinical interactions are developed in Chapter 63.
58.9 Cardiac Pulsations Reveal Responses, Not a Direct Volume Measurement
The cardiac ICP waveform reflects pulsatile vascular input filtered through the craniospinal system. Conventional descriptions identify an early percussion peak, P1, a subsequent tidal component, P2, and a later dicrotic component, P3. These labels describe recurring waveform features; they do not assign each peak exclusively to one anatomical structure.
If pulsatile intracranial volume input were unchanged, a less compliant system would produce a larger pressure pulse. That conditional statement explains the interest in pulse amplitude and morphology as indicators of reserve. In practice, arterial pulse pressure, vascular tone, venous outflow, and the volume displaced with each beat may also change.
Cardoso and colleagues studied 15 awake patients with several intracranial disorders. Head elevation, CSF withdrawal, and voluntary hyperventilation could lower mean ICP, but their effects on waveform components differed. Hyperventilation particularly altered P2. Comparable changes in mean pressure therefore did not imply identical changes in the system producing the waveform. 6
In six anesthetized, ventilated dogs undergoing experimental extradural balloon expansion, Avezaat and colleagues found that pulse pressure and the volume–pressure response initially increased together but diverged at higher pressures. The preparation reinforces that the pressure pulse is affected by vascular physiology as well as mechanical accommodation. Its experimental breakpoint is not a human intervention threshold. 7
A larger P2 relative to P1 or a rising pulse amplitude can consequently prompt concern about altered reserve, but neither provides a direct calibrated compliance in mL/mmHg. The required pulsatile volume input has not been independently measured, and the recording system may itself distort peak shape.
A falling pulse amplitude is not invariably reassuring either. It can reflect reduced pulsatile input, severe perfusion compromise, a changed vascular state, or technical damping. The mean pressure, arterial waveform, clinical trajectory, and recording quality determine its meaning.
Waveform interpretation is strongest when a reproducible change is compared within the same patient under known conditions. It becomes weaker when an isolated shape is treated as a diagnosis or a universally validated treatment target.
58.10 Slow Waves and Derived Indices Need Physiological Context
ICP varies over respiratory cycles and over longer periods as well as with each heartbeat. Slower oscillations may reflect vascular tone, systemic pressure changes, carbon dioxide variation, and interactions between perfusion regulation and limited reserve. Frequency and shape alone do not identify one exclusive mechanism.
Plateau waves are episodes of substantial sustained pressure elevation followed by a return toward the preceding baseline. They can arise from feedback between vascular dilation, increased blood volume, rising ICP, and declining perfusion pressure. Their development does not require a newly expanding hematoma during every episode.
Czosnyka and colleagues continuously monitored 160 head-injured patients; detailed hemodynamic analysis included 16 plateau episodes in eight patients. The findings supported vasodilation in a system with depleted compensatory reserve. Flow velocity and calculated perfusion pressure changed by different proportions, illustrating why neither pressure nor Doppler velocity alone fully characterizes tissue perfusion. The observational findings do not make plateau waves harmless or define a universal treatment response. 8
The RAP index is one attempt to characterize reserve continuously. It is a moving Pearson correlation coefficient between mean ICP and ICP pulse amplitude, ranging from −1 to +1. R denotes correlation, A amplitude, and P pressure. Because correlation is dimensionless, RAP is not compliance or elastance expressed in physical units.
When amplitude increases with mean pressure, their positive correlation can be consistent with movement along a steeper pressure–volume region. A weak correlation can occur when reserve is relatively preserved, but also when signals have little useful variation or when vascular physiology has changed profoundly.
In an original study of 56 ventilated head-injured patients, Czosnyka and colleagues described complex amplitude–pressure behavior and loss or reversal of correlation in patients with severe deterioration. This cautions against interpreting a low RAP as invariably favorable. Association with outcome does not establish that targeting the index improves outcome. 9
Derived indices also inherit the limitations of their inputs: baseline artifacts, waveform distortion, drainage state, and missing or nonstationary data. Their role is to enrich interpretation of the evolving system rather than replace anatomical and clinical information.
58.11 Monitoring Methods and Threshold Evidence Answer Different Questions
A ventricular catheter can measure fluid pressure and permit CSF drainage. A catheter-tip tissue sensor measures pressure locally and avoids external fluid-column leveling, but most such probes cannot be re-zeroed to atmosphere after implantation. In a prospective multicenter evaluation of 99 Neurovent-P catheters, Citerio and colleagues found that clinically encountered baseline drift remained a concern despite generally robust device performance. Results for that device and study should not be assigned indiscriminately to every sensor. 10
An external ventricular drain also changes the system it measures. Drainage removes volume, and an open fluid pathway can alter the pressure signal. Tubing, air, obstruction, and frequency response influence the waveform. Teichmann and colleagues' bench experiments demonstrated substantial waveform distortion in an EVD system, including effects of drainage configuration and trapped air. A displayed waveform therefore requires validation for the particular analysis being attempted; changing the drain configuration is a clinical procedure, not a casual diagnostic experiment. 11
Noninvasive findings supply complementary evidence. CT identifies anatomy, while optic nerve sheath ultrasound and Doppler assess pressure-related structural or vascular changes. In Robba and colleagues' prospective study, 445 examinations in 64 patients showed useful associations between selected ultrasound measurements and invasive ICP. Heterogeneous disease, operator dependence, and imperfect estimation limit substitution for a continuously measured intracranial pressure. 12
Pressure duration also matters. Güiza and colleagues analyzed data from 261 adults and 99 children with traumatic brain injury and found that the association between pressure episodes and outcome depended on intensity and duration. These were observational relationships in treated patients, not experimentally proven safe exposure times. 13
The current Brain Trauma Foundation severe-TBI guidance gives a Level IIB recommendation to treat ICP above 22 mmHg because higher values are associated with increased mortality, and also supports integrating clinical and CT findings. The numerical threshold is a clinical recommendation for that population, not a universal boundary between intact and injured brain. 14
BEST:TRIP randomized 324 patients aged at least 13 years with severe TBI in Bolivia and Ecuador to two management protocols. The ICP-guided protocol was not superior on the prespecified composite of survival and functional and cognitive recovery to an imaging–clinical examination protocol. The trial compared complete strategies in a particular setting; it neither proves that pressure is irrelevant nor establishes benefit from every monitor-directed action. 15
58.12 Integrating a Changing Pressure Signal
Consider an illustrative patient with an intact skull after traumatic brain injury. A ventricular pressure initially reads 16 mmHg and later 24 mmHg after repositioning. The first task is to determine whether these are comparable measurements: the transducer reference, drain state, waveform quality, and sensor function must be established.
Suppose inspection identifies an external transducer now 8 cm below its intended reference. The expected hydrostatic excess is 8 × 0.736 ≈ 5.9 mmHg. Correct leveling would account for much of the apparent rise, potentially leaving a pressure near 18 mmHg. This is an estimated instrument contribution, not a reason to dismiss the patient's examination or assume the remainder is benign.
Now suppose the independently verified pressure subsequently rises to 28 mmHg with an enlarging pulse amplitude and a new neurological change. Measurement error no longer explains the trajectory. Reduced reserve is plausible, but the waveform does not determine whether the cause is new blood, tissue swelling, venous obstruction, vascular dilation, or a combination.
The temporal context helps frame the next interpretation. A concurrent rise in carbon dioxide can support a vascular contribution. A position-related change with impaired venous drainage suggests a different boundary condition. New focal signs or imaging changes require attention to local distortion even if another monitor is less abnormal. None of these observations excludes concurrent causes.
If pressure falls after an intervention, its physiological meaning still requires examination. Lowering vascular volume can lower ICP while reducing flow; changing systemic pressure can alter both perfusion and intracranial vascular tone. Removing CSF changes volume and may move the operating point, but the response does not by itself identify the underlying disease or long-term reserve.
The coherent interpretation therefore follows pressure, waveform, anatomy, vascular conditions, and time together. Compliance supplies the mechanism connecting volume to pressure; perfusion and tissue deformation determine why the resulting state matters. Subsequent chapters build the pressure–flow, oxygen-delivery, and CSF-transport relationships needed to complete that assessment.
References
1. Marmarou A, Shulman K, LaMorgese J. Compartmental analysis of compliance and outflow resistance of the cerebrospinal fluid system. J Neurosurg. 1975;43:523–534. Original study.
2. Darrow D, Lee-Norris A, Larson A, Samadani U. Discrepancy between internal and external intracranial pressure transducers: quantification of an old source of error in EVDs? World Neurosurg. 2020;133:e18–e25. Original study.
3. Marmarou A, Shulman K, Rosende RM. A nonlinear analysis of the cerebrospinal fluid system and intracranial pressure dynamics. J Neurosurg. 1978;48:332–344. Original experimental model.
4. Slavin KV, Misra M. Infratentorial intracranial pressure monitoring in neurosurgical intensive care unit. Neurol Res. 2003;25:880–884. Original clinical series.
5. Feldman Z, Kanter MJ, Robertson CS, et al. Effect of head elevation on intracranial pressure, cerebral perfusion pressure, and cerebral blood flow in head-injured patients. J Neurosurg. 1992;76:207–211. Original study.
6. Cardoso ER, Rowan JO, Galbraith S. Analysis of the cerebrospinal fluid pulse wave in intracranial pressure. J Neurosurg. 1983;59:817–821. Original study.
7. Avezaat CJ, van Eijndhoven JH, Wyper DJ. Cerebrospinal fluid pulse pressure and intracranial volume-pressure relationships. J Neurol Neurosurg Psychiatry. 1979;42:687–700. Original experimental study.
8. Czosnyka M, Smielewski P, Piechnik S, et al. Hemodynamic characterization of intracranial pressure plateau waves in head-injury patients. J Neurosurg. 1999;91:11–19. Original study.
9. Czosnyka M, Guazzo E, Whitehouse M, et al. Significance of intracranial pressure waveform analysis after head injury. Acta Neurochir (Wien). 1996;138:531–541. Original study.
10. Citerio G, Piper I, Chambers IR, et al. Multicenter clinical assessment of the Raumedic Neurovent-P intracranial pressure sensor: a report by the BrainIT group. Neurosurgery. 2008;63:1152–1158. Original device evaluation.
11. Teichmann D, Lynch JC, Heldt T. Distortion of the intracranial pressure waveform by extraventricular drainage system. IEEE Trans Biomed Eng. 2021;68:1646–1657. Original bench study.
12. Robba C, Cardim D, Tajsic T, et al. Ultrasound non-invasive measurement of intracranial pressure in neurointensive care: a prospective observational study. PLoS Med. 2017;14:e1002356. Original study.
13. Güiza F, Depreitere B, Piper I, et al. Visualizing the pressure and time burden of intracranial hypertension in adult and paediatric traumatic brain injury. Intensive Care Med. 2015;41:1067–1076. Original observational study.
14. Brain Trauma Foundation. Guidelines for the Management of Severe Traumatic Brain Injury, fourth edition. Sections on ICP monitoring and ICP thresholds. Current official recommendations.
15. Chesnut RM, Temkin N, Carney N, et al. A trial of intracranial-pressure monitoring in traumatic brain injury. N Engl J Med. 2012;367:2471–2481. Original randomized trial.