Cardiovascular Autoregulation and Regional Blood Flow
An organ's blood flow depends on the pressure driving blood through it and the resistance of its vessels. Local responses can buffer pressure changes and increase flow when tissue activity rises. These responses have limits, and different organs may reach those limits at different times during critical illness.
14.1 Organ Flow Depends on a Pressure Difference
Blood enters an organ through its arterial supply and leaves through its venous drainage. In a simplified steady-flow model:
The inflow pressure is the pressure actually reaching the organ. A peripheral arterial catheter measures pressure at its own location, which may differ because of intervening vascular disease, posture, or the pressure reference used. The effective outflow pressure describes the downstream condition limiting flow. Depending on the organ and circumstances, venous pressure, tissue pressure, or compression of a vulnerable vessel may be important.
A rise in downstream pressure reduces the pressure difference available to move blood. The arterial pressure can remain unchanged while the driving difference falls. Central venous pressure may help explain the problem, but it does not represent every organ's effective outflow pressure under all conditions.
For illustration, let inflow pressure be 70 mm Hg and effective outflow pressure 5 mm Hg:
70 − 5 = 65 mm Hg driving difference
Now let outflow pressure rise to 20 mm Hg while inflow pressure stays at 70 mm Hg:
70 − 20 = 50 mm Hg driving difference
If resistance stayed fixed, flow would change in the same proportion as this pressure difference. Compare the new value with the original:
50 ÷ 65 × 100 ≈ 77% of the original flow
Flow would be about 23% lower under those assumptions. These are illustrative values, not a prediction of the response of a particular organ.
Real vessels can change resistance. Dilation may partly preserve flow as the driving pressure falls. The capacity to make that adjustment cannot be determined from one pressure and flow measurement. That measurement shows the current state, not how much compensation remains.
At the bedside, identify the relevant gradient before deciding how to change it. Raising arterial pressure, reducing venous congestion, and relieving tissue compression address different parts of the equation. Their effects on the heart and the rest of the circulation also need to be assessed.
14.2 Pressure Autoregulation and the Myogenic Response
Pressure autoregulation is the ability of a vascular bed to limit changes in flow when perfusion pressure changes. If pressure rises, an increase in resistance can restrain the flow increase. If pressure falls, a reduction in resistance can help preserve flow.
The myogenic response contributes to this adjustment. Increased pressure stretches the vessel wall. Vascular smooth muscle responds with active contraction, narrowing the lumen and increasing resistance. Reduced stretch can favor relaxation. Bayliss described intrinsic arterial responses to internal pressure in foundational experimental work. The response can occur locally without a new signal from the central nervous system. 1
Compensation is limited. At low pressure, resistance vessels may already be near maximal dilation. Further pressure reduction then causes a larger fall in flow. At high pressure, the available constriction may no longer restrain flow or protect downstream vessels sufficiently. The lower and upper limits describe these boundaries under the conditions being examined.
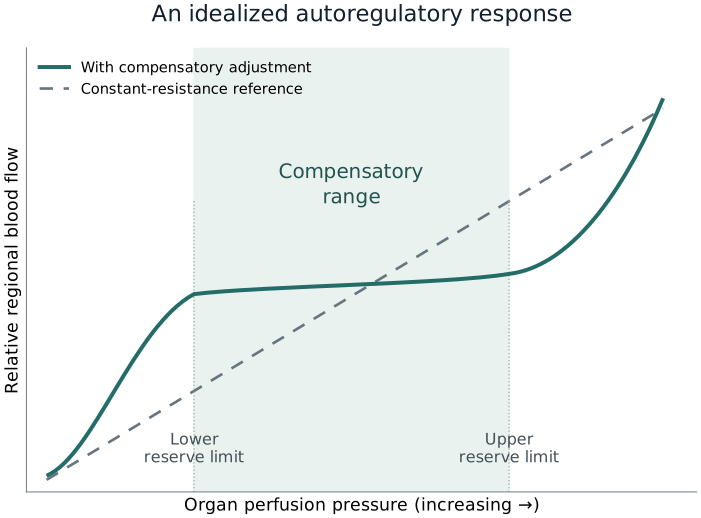
Figure 14.1 shows the resulting idealized relationship. Over the middle range, resistance adjustment makes the flow curve flatter than the constant-resistance reference. Below the lower limit, dilation cannot fully compensate for falling pressure. Above the upper limit, flow becomes more dependent on further pressure increases.
The plateau is not perfectly flat, and its boundaries are not universal pressure thresholds. The organ, disease, metabolic activity, carbon dioxide, drugs, and speed of pressure change can alter both its slope and its limits. A textbook curve cannot locate a particular patient's operating point without relevant measurements.
Timing matters as well. Flow may change immediately after a sudden pressure step, before vascular resistance has adjusted. A later measurement may show partial recovery of flow. Static assessments examine the relationship after conditions have stabilized; dynamic assessments examine the response over time. They describe different aspects of regulation.
14.3 Metabolic Regulation Matches Flow to Local Work
Pressure autoregulation responds to a change in driving pressure. Metabolic regulation responds to tissue activity and the resources needed to support it. The mechanisms interact, but they do not serve identical functions.
When tissue activity increases, local chemical signals can relax resistance vessels. More blood then reaches the active tissue without requiring a large increase in arterial pressure. This increase in flow is called functional hyperemia. It occurs, for example, as skeletal muscle contracts or myocardial work increases.
Changes in oxygen availability, carbon dioxide, hydrogen ions, potassium, and metabolites can contribute to local signaling. Their importance differs among organs and conditions. No single substance explains every metabolic flow response.
Berne studied cardiac nucleotide changes during hypoxia and proposed that adenosine contributes to coronary metabolic regulation. His experiments helped connect myocardial metabolism with reduced coronary resistance. They established an influential hypothesis, not proof that adenosine alone controls all coronary blood flow. 2
Reactive hyperemia occurs after a temporary reduction or interruption of flow. Local dilator influences accumulate while supply is restricted. When flow is restored, the vessels can conduct more blood than before the interruption, producing a transient overshoot. The response depends on available reserve and does not establish that the tissue escaped injury.
Increased flow therefore has several possible meanings. It may meet higher metabolic demand, compensate for reduced arterial oxygen content, or reflect disturbed vascular regulation. Lower flow may be adequate when metabolic demand has fallen. Interpret flow with tissue activity and blood oxygen content rather than treating the flow value alone as evidence of adequate or inadequate supply.
14.4 The Endothelium and Systemic Control Modify Local Responses
The endothelium forms the inner surface of blood vessels. It senses chemical signals and mechanical forces from flowing blood. It can release mediators that change adjacent smooth muscle tone and influence inflammation and interactions with circulating cells.
Furchgott and Zawadzki found that acetylcholine-induced relaxation of isolated arterial preparations depended on intact endothelial cells. The endothelium provided a relaxing influence that acted on the smooth muscle. Their experiments established that the vessel lining participates actively in regulating vascular tone. 3
This creates an additional link between local conditions and resistance. A stimulus reaching endothelial cells can change the signals delivered to the muscle, altering vessel caliber. Flow also produces shear at the endothelial surface. Inflammation or injury can change the balance of dilator and constrictor signaling, so the same pressure may produce different regional flow after endothelial dysfunction develops.
Local control operates within systemic regulation. Sympathetic activation and circulating hormones help maintain arterial pressure and redistribute flow during stress. Their regional effects depend on receptor distribution, the state of the vessels, and competing local metabolic signals.
A vasoactive drug may therefore raise the pressure available to one organ while increasing resistance in another. It may also change venous tone, venous return, cardiac output, and ventricular afterload. Its net effect cannot be predicted simply by calling it a vasoconstrictor or vasodilator.
Observe the resulting circulation. An arterial pressure increase may be useful if it improves organ perfusion without an unacceptable reduction in output or other harm. Local responsiveness can change during illness, so a previously favorable response may need reassessment later.
14.5 The Brain: Pressure, Metabolism, and Intracranial Conditions
Cerebral vessels respond to perfusion pressure and neuronal activity. Carbon dioxide also changes their tone. A rise in arterial carbon dioxide generally dilates cerebral resistance vessels and increases flow; a fall generally constricts them and reduces flow. Brain injury and other conditions can modify these responses. Cerebral flow can therefore change while mean arterial pressure remains the same.
Intracranial pressure changes the pressure opposing arterial inflow. Cerebral perfusion pressure is commonly approximated as mean arterial pressure minus intracranial pressure, with both pressures referenced appropriately. Higher venous outflow pressure or other constraints can make the effective relationship more complicated.
For an illustrative mean arterial pressure of 80 mm Hg and intracranial pressure of 20 mm Hg:
80 − 20 = 60 mm Hg estimated cerebral perfusion pressure
This calculation explains the pressure difference; it does not establish whether cerebral flow is adequate or specify a treatment target. The pressure references and the brain's vascular response remain essential.
Prior disease can alter that response. Strandgaard and colleagues studied cerebral flow during pressure changes in patients with severe hypertension and normotensive controls. The hypertensive group had a higher lower autoregulatory limit. These findings support adaptation to chronic pressure conditions, but do not establish an identical shift in every patient with a history of hypertension. 4
Acute brain injury can impair reactivity and make flow more pressure dependent. Regions around an injury may behave differently from other brain regions. Sedation, temperature, seizures, oxygen content, and carbon dioxide can further change demand or vascular tone.
A systemic pressure adequate for another organ may therefore be insufficient for a particular injured brain. Conversely, increasing arterial pressure does not guarantee benefit if intracranial pressure, edema, or impaired vascular responses limit the result. Connect systemic hemodynamics to the neurological diagnosis and appropriate brain monitoring rather than choosing a target from a generic plateau or outpatient blood pressure.
14.6 The Kidney: Flow and Filtration Are Related but Different
The kidney regulates blood flow and glomerular filtration through interacting mechanisms. Myogenic responses in the preglomerular vessels contribute. Tubuloglomerular feedback provides another form of local control by linking tubular salt delivery to filtration in the same nephron.
After filtration, tubular fluid passes through segments that reabsorb water and solute. The macula densa senses salt delivery at a later tubular site. Increased delivery can trigger signals that increase afferent arteriolar resistance. This lowers glomerular capillary pressure and tends to reduce filtration. The feedback helps limit further delivery to the tubule.
Schnermann and colleagues examined superficial-nephron filtration during controlled changes in loop perfusion in rats. Their experiments demonstrated feedback between tubular conditions and filtration. The findings show that filtration is locally regulated rather than passively determined by systemic arterial pressure alone. 5
Renal blood flow and glomerular filtration rate describe different processes. Blood flow is the volume passing through the renal circulation. Filtration is the movement of fluid from glomerular capillaries into the nephron. It depends on pressure relationships, resistance before and after the glomerulus, and the filtration barrier. Total renal flow and filtration need not change in the same proportion.
Urine output is a further downstream result. The tubules can return much of the filtered water to the circulation. Hormonal water conservation, tubular injury, obstruction, and diuretic treatment change how much eventually leaves as urine. Oliguria therefore cannot locate the kidney on an autoregulation curve. Increased urine output after treatment also does not, by itself, prove that renal injury has reversed.
Renal venous congestion and elevated abdominal or tissue pressure can reduce the effective perfusion gradient. An apparently adequate arterial pressure may coexist with these downstream constraints. Raising arterial pressure addresses only one possible limitation.
Combine urine-output trends with renal function, fluid balance, congestion, pressure conditions, and the overall circulation. Persistent oliguria requires an explanation rather than an automatic sequence of fluid boluses or progressively higher arterial pressure targets.
14.7 Regional Flow Reflects Different Organ Priorities
Organs regulate flow according to different tasks. Coronary flow supplies myocardial work. Cerebral flow supports neuronal activity. Renal flow supports filtration as well as tissue metabolism. Skin flow also helps regulate heat loss.
These tasks produce different responses to the same systemic condition. Increased myocardial work can promote coronary dilation. Cooling and sympathetic activation can constrict skin vessels. A change in skin flow therefore does not necessarily indicate the same change in coronary or cerebral oxygen supply.
During stress, systemic mechanisms redistribute blood among vascular beds. This can help sustain selected functions, but it does not protect every region completely. A rise in total cardiac output describes more blood moving through the circulation overall. It does not reveal how that extra flow is divided among organs.
The splanchnic circulation illustrates the limits of global measurements. Local arterial obstruction, abdominal disease, tissue compression, or vasomotor changes may restrict bowel perfusion while systemic pressure remains acceptable. A normal arterial pressure cannot exclude mesenteric ischemia.
Skin is easier to examine. Capillary refill and mottling provide accessible observations of peripheral perfusion. Temperature and sympathetic tone also affect them, and they do not directly measure renal or intestinal flow. Their value comes from adding information that pressure and cardiac output alone do not provide.
Combine complementary findings. Improved pressure and forward flow, better skin perfusion, appropriate mentation where assessable, and improving relevant organ function support a more complete assessment. Discordant findings deserve investigation because regional regulation and disease can produce different responses.
14.8 Sepsis Can Disrupt the Link Between Global and Local Perfusion
Sepsis changes vascular signaling, endothelial function, and interactions between blood cells and vessel walls. Microvascular flow may become uneven. Some pathways carry blood while neighboring pathways have slow, intermittent, or absent flow. An adequate total flow can conceal these local differences.
De Backer and colleagues demonstrated altered sublingual microvascular perfusion in patients with sepsis. Their observations showed regional flow abnormalities that global pressure and output measurements did not fully describe. Sublingual imaging samples an accessible vascular bed; it does not directly measure every internal organ. 6
Uneven perfusion can impair exchange even when the large-vessel circulation appears satisfactory. Blood moving through one pathway cannot necessarily compensate for inadequate delivery to tissue supplied by another. Regional obstruction, altered distribution, and cellular injury may coexist.
Pressure autoregulation can also change during critical illness. The extent depends on the vascular bed, stage of illness, and measurement conditions. Low systemic vascular resistance is an average description of the systemic circulation. It does not prove that every organ is maximally dilated or that all local regulation has disappeared.
Raising arterial pressure can improve flow when inadequate driving pressure is limiting it. The response may be small if the main problem is obstructed pathways, marked heterogeneity, or an already sufficient pressure gradient. Additional vasoconstriction can also alter regional distribution and increase ventricular load.
Correcting inadequate systemic pressure and output remains important in shock. Their restoration creates conditions that may support organ perfusion, but it does not prove that tissue exchange has recovered. Reassess organ and perfusion findings after the systemic measurements improve. Persistent abnormalities call for a search for their mechanism rather than automatic escalation of pressure or output.
14.9 Assessing Autoregulation and Organ Response
Autoregulation describes how flow responds when perfusion conditions change. A single pressure and organ observation show one operating state. They cannot define the slope, limits, or reserve of an autoregulation curve.
Specialized cerebral methods assess relationships between pressure signals and physiological surrogates. Pressure-reactivity measures examine changes in arterial and intracranial pressures. A tendency for both to rise together may indicate that arterial pressure changes are being transmitted into intracranial blood volume with inadequate vascular compensation. This is a surrogate assessment influenced by intracranial mechanics and other conditions, not a direct flow measurement.
Transcranial Doppler measures blood velocity. Velocity represents volume flow reliably only when the relevant vessel dimensions and other assumptions remain suitable. Near-infrared measurements sample regional tissue oxygenation, which also depends on oxygen delivery, consumption, and the tissue sampled. Neither method independently describes perfusion throughout the whole brain.
Tas and colleagues tested autoregulation-guided cerebral perfusion management after traumatic brain injury in the COGiTATE feasibility randomized trial. The study supported the feasibility of the strategy. It did not establish that the monitoring algorithm improves neurological outcomes across brain injuries or other ICU populations. 7
Routine organ markers have their own delays and confounders. Urine output may change slowly. Creatinine does not provide an immediate renal flow measurement. Lactate reflects production and clearance as well as perfusion, so a persistently high value does not locate a regional pressure deficit.
A clinically indicated pressure adjustment can still be informative. State the intended benefit and follow flow, rhythm, ventricular function, congestion, and the relevant organ findings. Keep track of other changes that could explain the response. This evaluates a treatment at the current operating state; it does not establish a complete autoregulation curve.
Avoid creating unsafe pressure conditions to search for a theoretical limit. The useful assessment is whether a justified intervention improves perfusion without unacceptable consequences elsewhere in the circulation.
14.10 Pressure-Target Trials Test the Clinical Strategy
Physiology can explain why additional perfusion pressure might help a particular organ. A clinical trial tests a different question: whether pursuing a target improves outcomes after accounting for the treatment needed to reach it. Higher pressure may require more vasoactive exposure and increase arrhythmia risk or ventricular loading.
In SEPSISPAM, Asfar and colleagues compared mean arterial pressure targets of 80–85 and 65–70 mm Hg in septic shock. Higher targeting did not significantly reduce mortality and caused more newly diagnosed atrial fibrillation. In the chronic-hypertension subgroup, renal replacement therapy was less frequent with the higher target, without a survival benefit. That subgroup finding does not establish a high target for every hypertensive patient. 8
The 65 trial studied older patients with vasodilatory hypotension. Lamontagne and colleagues compared a permissive target of 60–65 mm Hg with usual care. The lower-target group received less vasopressor treatment. The primary unadjusted comparison did not establish a statistically significant reduction in 90-day mortality. This was not an equivalence trial proving that every lower target is suitable for every shock state. 9
In OPTPRESS, Endo and colleagues studied patients aged 65 years or older with septic shock in Japan. Targeting 80–85 mm Hg increased 90-day mortality compared with 65–70 mm Hg. The trial stopped early after interim findings suggested harm. Age or previous hypertension therefore cannot be assumed to justify a high-pressure strategy. 10
The 2026 Surviving Sepsis Campaign recommends an initial MAP target of 65 mm Hg over higher targets for adults with septic shock. For those aged 65 years or older, it conditionally suggests an initial range of 60–65 mm Hg over higher ranges, with low-certainty evidence. These are starting strategies for the specified population, not measured autoregulatory limits. 11
The trials did not map every participant's pressure–flow curve. Their findings must be integrated with the diagnosis, organ perfusion, downstream pressure, ventricular reserve, and treatment effects. A pressure adjustment should have an explicit purpose and a planned reassessment. Persistent abnormality in one organ marker is not evidence that progressively higher pressures will help.
14.11 An Integrated Bedside Example
Consider an illustrative patient with septic shock, previous hypertension, and oliguria. Mean arterial pressure is near 70 mm Hg and CVP is 20 mm Hg. The patient has received substantial fluid, and cardiac output is being followed with a suitable measurement method.
First examine the pressure difference. If CVP approximates the relevant downstream pressure:
70 − 20 = 50 mm Hg estimated driving difference
This is not a direct measurement of renal perfusion pressure or flow. Abdominal and renal tissue pressure may add constraints, and renal vascular resistance can change. The calculation identifies why arterial pressure alone provides an incomplete explanation.
Suppose a clinically justified assessment at a higher pressure improves capillary refill but produces no early change in urine output. Review output and congestion at the same time. The different responses do not establish that one measurement is wrong. Skin and kidney have different regulatory influences, and urine production can respond later than vascular flow.
Unchanged urine output neither proves that renal flow failed to improve nor justifies indefinite pressure escalation. Established tubular injury, hormonal conservation, obstruction, or congestion may still limit urine production. The time course and other renal findings help distinguish these possibilities.
Now suppose further vasoactive treatment reduces stroke volume or provokes an arrhythmia. Arterial pressure has increased, but the overall circulation may be worse. Reassess whether any regional benefit justifies those consequences rather than judging success from pressure alone.
Further management addresses the supported causes of impaired perfusion and oliguria. Review volume distribution, venous and tissue pressures, renal pathology, and the ongoing need for pressure support. The aim is adequate organ perfusion with tolerable treatment effects, not a single pressure that immediately normalizes every marker.
References
1. Bayliss WM. On the local reactions of the arterial wall to changes of internal pressure. J Physiol. 1902;28:220–231. doi:10.1113/jphysiol.1902.sp000911.
2. Berne RM. Cardiac nucleotides in hypoxia: possible role in regulation of coronary blood flow. Am J Physiol. 1963;204:317–322. doi:10.1152/ajplegacy.1963.204.2.317.
3. Furchgott RF, Zawadzki JV. The obligatory role of endothelial cells in the relaxation of arterial smooth muscle by acetylcholine. Nature. 1980;288:373–376. doi:10.1038/288373a0.
4. Strandgaard S, Olesen J, Skinhøj E, Lassen NA. Autoregulation of brain circulation in severe arterial hypertension. Br Med J. 1973;1(5852):507–510. doi:10.1136/bmj.1.5852.507.
5. Schnermann J, Wright FS, Davis JM, von Stackelberg W, Grill G. Regulation of superficial nephron filtration rate by tubulo-glomerular feedback. Pflugers Arch. 1970;318(2):147–175. doi:10.1007/BF00586493.
6. De Backer D, Creteur J, Preiser JC, Dubois MJ, Vincent JL. Microvascular blood flow is altered in patients with sepsis. Am J Respir Crit Care Med. 2002;166(1):98–104. doi:10.1164/rccm.200109-016OC.
7. Tas J, Beqiri E, van Kaam RC, et al. Targeting autoregulation-guided cerebral perfusion pressure after traumatic brain injury (COGiTATE): a feasibility randomized controlled clinical trial. J Neurotrauma. 2021;38(20):2790–2800. doi:10.1089/neu.2021.0197.
8. Asfar P, Meziani F, Hamel JF, et al.; SEPSISPAM Investigators. High versus low blood-pressure target in patients with septic shock. N Engl J Med. 2014;370(17):1583–1593. doi:10.1056/NEJMoa1312173.
9. Lamontagne F, Richards-Belle A, Thomas K, et al.; 65 trial investigators. Effect of reduced exposure to vasopressors on 90-day mortality in older critically ill patients with vasodilatory hypotension: a randomized clinical trial. JAMA. 2020;323(10):938–949. doi:10.1001/jama.2020.0930.
10. Endo A, Yamakawa K, Tagami T, et al.; OPTPRESS trial investigators. Efficacy of targeting high mean arterial pressure for older patients with septic shock (OPTPRESS): a multicentre, pragmatic, open-label, randomised controlled trial. Intensive Care Med. 2025;51(5):883–892. doi:10.1007/s00134-025-07910-4.
11. Society of Critical Care Medicine and European Society of Intensive Care Medicine. Surviving Sepsis Campaign: International Guidelines for Management of Sepsis and Septic Shock 2026. Official recommendations.