Pressure–Volume Loops and Myocardial Mechanics
A pressure–volume loop brings ventricular filling, pressure generation, and ejection onto one diagram. It shows why the same stroke volume can require different amounts of work. It also helps separate a change in loading from a change in ventricular performance.
10.1 Reading the Axes and the Width of the Loop
A ventricular pressure–volume loop plots chamber volume on the horizontal axis and chamber pressure on the vertical axis. Each point represents the pressure and volume at one instant. Following the points in time traces one cardiac cycle.
Moving right means that chamber volume is increasing. Moving left means that it is decreasing. Moving upward means that pressure is rising. A vertical segment indicates a pressure change with little or no change in volume. The diagram does not have a time axis, so the length of a segment does not directly show how long that phase lasts.
End-diastolic volume is the volume present immediately before ventricular systole. End-systolic volume is the volume remaining after ejection. In a ventricle with competent valves and no abnormal flow pathway, their difference is the ejected stroke volume:
The loop’s width shows how much chamber volume falls during ejection. For an illustrative end-diastolic volume of 130 mL and end-systolic volume of 50 mL:
130 − 50 = 80 mL ejected per beat
The loop spans those two volumes, so its horizontal width represents an 80 mL stroke volume. These assumed values are neither normal limits nor treatment targets.
Ejection fraction expresses the same ejected volume relative to the starting volume:
Divide the ejected volume by the volume present before ejection, then multiply by 100:
80 ÷ 130 × 100 ≈ 62%
The ventricle has ejected about 62% of its starting volume. A similar percentage can describe a small or a large chamber. It therefore does not specify stroke volume or cardiac output on its own.
With regurgitation, some blood leaves the ventricle through a backward pathway. Chamber volume falls as both forward and regurgitant blood leave. Loop width therefore describes their combined volume, not necessarily the volume entering the systemic circulation. Check valve function before equating total chamber stroke volume with forward output.
10.2 Following the Four Phases of an Idealized Left Ventricular Beat
Begin at A, the lower right point in Figure 10.1. Filling has ended. As ventricular pressure rises above atrial pressure, the mitral valve closes. The aortic valve has not yet opened, so blood cannot enter or leave through either competent valve. Contraction raises pressure at nearly constant volume. The path rises from A to B: isovolumic contraction.
At B, ventricular pressure exceeds aortic pressure and the aortic valve opens. Blood leaves, ventricular volume falls, and the path moves leftward. This is ejection. In the illustrated beat, pressure rises early and falls later. The exact contour depends on ventricular activation, arterial load, and the rate of ejection.
At C, the aortic valve closes as ventricular pressure falls and forward ejection ends. The mitral valve remains closed until ventricular pressure falls below atrial pressure. With both valves closed, pressure falls at nearly constant volume along C to D. This is isovolumic relaxation. Volume stays nearly constant, but the muscle still uses energy to handle calcium and relax.
At D, ventricular pressure falls below left atrial pressure and the mitral valve opens. Blood enters, volume rises, and the path moves rightward toward A. This is filling. Continuing relaxation and ventricular recoil affect pressure early in filling. Passive chamber properties and atrial contraction influence it as filling proceeds. The cycle returns to A and repeats.
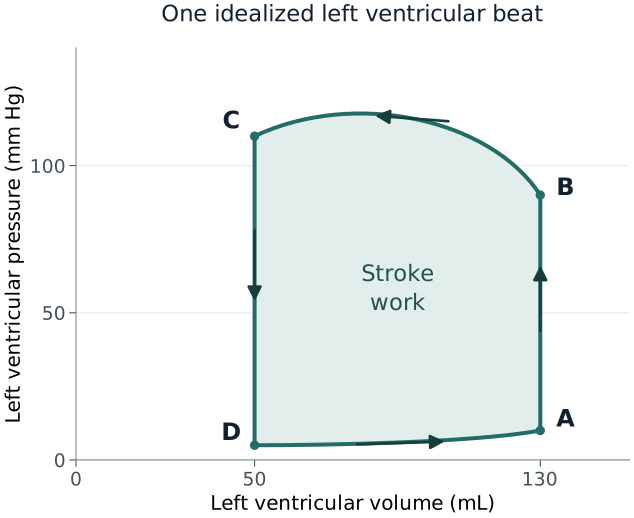
The diagram assumes competent valves and a conventional left ventricular cycle. Real valve motion and blood acceleration are dynamic. Regurgitation, mechanical support, and unusual loading can remove the clearly defined vertical phases. Right ventricular loops also have a different contour because the pulmonary circulation presents a different load.
10.3 Loop Area, Stroke Work, and Power
The loop’s enclosed area represents net pressure–volume work during one beat. The ventricle pushes blood out while its pressure is relatively high. Blood enters again while pressure is much lower. The work associated with high-pressure ejection exceeds the work associated with low-pressure filling. Their difference is represented by the area between the upper and lower paths.
A wider loop does not necessarily mean more work than a narrower one. Pressure matters as well as ejected volume. Ejecting a given volume at a higher pressure generally requires more pressure–volume work, provided the other conditions are comparable.
For a simple illustrative calculation, approximate the loop as a rectangle. Let its width be an 80 mL stroke volume. Use an average ejection pressure of 100 mm Hg and average filling pressure of 10 mm Hg. The effective height is 100 − 10, or 90 mm Hg. Multiply height by width to estimate net work:
Convert the pressure–volume units into energy. One mm Hg·mL is approximately 0.000133 joules:
7,200 × 0.000133 ≈ 0.96 joules per beat
This estimate assumes the rectangular pressure pattern described above. For a real loop, pressure changes continuously. Work must be calculated from the area within its actual contour rather than treating the whole loop as a rectangle.
Power is work per unit time. At 75 beats/min:
0.96 joules/beat × 75 beats/min = 72 joules/min
There are 60 seconds in a minute:
72 ÷ 60 = 1.2 joules/second = 1.2 watts
More frequent beats can therefore increase work per minute even if the pressure–volume loop of each beat changes little.
Stroke work describes a mechanical output. The heart also uses energy to activate contraction, generate force, handle calcium, relax, and maintain its cells. Loop area does not measure all of that energy use. If blood is ejected through a regurgitant pathway, part of the measured chamber work may also fail to support useful forward circulation.
The distinction matters clinically. A ventricle can perform substantial pressure–volume work yet provide inadequate effective output. A lower loop area can reflect useful unloading, but it can also reflect loss of pressure generation or ejection. The clinical meaning depends on the accompanying circulation.
10.4 How Loading Changes the Loop
An isolated increase in filling moves the end-diastolic point toward a greater volume. If the ventricle is preload responsive and the other conditions are similar, the next beat ejects more blood and the loop widens. The accompanying pressure rise depends on the diastolic pressure–volume relationship.
An isolated increase in arterial load requires more ventricular pressure before and during ejection. Hold starting volume and contractile state constant. The ventricle ejects less against the greater load, leaving more blood at end systole. Higher pressure makes the conventional loop taller, while the smaller ejected volume makes it narrower.
Stronger systolic activation can increase ejection when loading is comparable. Less blood remains at end systole, so end-systolic volume falls and loop width may increase. Arterial properties help determine the pressure reached during that extra ejection. A pressure rise alone therefore cannot show how much activation or flow increased.
These descriptions isolate one influence to make the mechanism understandable. They do not imply that actual treatments change only one variable. Fluid can alter both filling and vascular pressure. A catecholamine can affect venous recruitment, arterial load, heart rate, and activation together. Ventilation can change external pressure and right ventricular function at the same time.
Also identify which beat is being examined. The first beat after a sudden afterload increase starts with the volume already present at end diastole. If it ejects less, more blood remains. Continuing inflow can then increase the next beat’s end-diastolic volume and recruit a Frank–Starling response. Reflexes and changes in vascular distribution may further alter later beats.
A diagram labeled as an immediate response should not be confused with the new steady state several minutes later. When comparing clinical measurements, identify what changed between them and whether the circulation had time to adjust.
10.5 The End-Systolic Pressure–Volume Relationship
One loop describes one beat under its current loading conditions. To examine how the ventricle behaves across loads, record several loops while changing loading in a controlled way. Mark the pressure and volume at end systole for each beat. The relationship through those points is the end-systolic pressure–volume relationship, or ESPVR.
Over a limited range, a straight line may approximate those points. Its slope, Ees, describes how much end-systolic pressure changes per unit change in end-systolic volume. Extending the line to zero pressure gives its volume-axis intercept, V₀. Both slope and intercept determine where the line lies. A shift in the relationship cannot always be described by changing its slope alone.
Suga and Sagawa's experiments in excised, supported canine ventricles helped establish the time-varying pressure–volume framework. Their work provided a way to study chamber behavior across loading conditions instead of treating one pressure or ejection fraction as a complete measure of contraction. 1
A steeper or left-shifted end-systolic relationship can support an interpretation of greater systolic chamber performance when the measurements and conditions are appropriate. It should not be described as an exact assay of intrinsic muscle contractility independent of chamber geometry, coronary perfusion, or the experimental loading range.
The true relationship may also curve. A line fitted over one volume range may fail to describe another range. Extending it far beyond the observed points can therefore give misleading pressures or intercepts. V₀ is a model parameter, even when it is reported to several decimal places; it is not a directly observed empty-heart volume.
Do not calculate Ees by simply dividing the pressure at one loop corner by its end-systolic volume. That shortcut assumes that V₀ is zero and that the line has the required shape. One pressure–volume point cannot establish those assumptions. Multi-beat analysis measures a relationship across loads; a single-beat method instead estimates it using additional validated assumptions and measurements.
At the bedside, the concept helps interpret why ejection fraction changes with afterload. A ventricle can move to a different operating point on a similar end-systolic relationship. The change in its observed ejection does not automatically prove a change in myocardial activation.
10.6 The End-Diastolic Relationship and the Role of Relaxation
The end-diastolic pressure–volume relationship, abbreviated EDPVR, describes chamber pressure at different end-diastolic volumes under specified conditions. It is usually curved. As volume increases, further filling generally requires an increasingly large pressure rise.
On a steeper diastolic relationship, the same volume increase produces a larger pressure rise. The chamber is harder to distend over that range. Intracavitary pressure also includes external effects, however. Pericardial constraint, expansion of the neighboring ventricle, or higher surrounding thoracic pressure can raise the measured pressure without an equivalent change in the muscle tissue’s passive stiffness.
Tyberg and colleagues demonstrated a contribution from pericardial surface pressure during volume loading in cardiac surgical patients. Their measurements illustrate why chamber pressure cannot always be interpreted as the pressure distending the wall. The operative findings support a mechanism, rather than a universal numerical correction for ICU filling pressures. 2
Relaxation adds a second influence: time. The muscle may still generate some active tension while filling begins. If that tension has not fully declined, filling pressure reflects both residual activation and passive distension. Tachycardia leaves less time for relaxation. Ischemia or disturbed calcium handling can slow it further.
The lower path of one loop follows filling as time passes. Relaxation is changing, blood is moving, and atrial contraction may add a late pressure rise. That path therefore need not equal the passive EDPVR. Establishing a passive chamber relationship requires measurements across volumes under conditions that account for these other influences.
The relaxation time constant, tau, describes the rate at which pressure falls during isovolumic relaxation within a fitted model. A longer tau indicates slower pressure decay when comparable models and conditions are used. Its value depends on the pressure-decay model and the measurements. Tau describes change over time. Compliance instead describes volume change per unit change in distending pressure.
This distinction explains why improving systolic ejection does not necessarily normalize filling. A ventricle can empty reasonably well yet develop high diastolic pressures. Its systolic relationship and its diastolic relationship must be interpreted separately.
10.7 Comparing Measures of Myocardial Performance
Different measurements describe different aspects of the beat. Ejection fraction measures fractional chamber emptying. Stroke volume measures a volume change. Stroke work combines pressure with volume displacement. None is completely independent of loading.
The maximum rate of ventricular pressure rise is written dP/dtmax. It describes the largest pressure increase per unit time during contraction, commonly expressed in mm Hg/s. It can rise with stronger myocardial activation. Starting volume, heart rate, rhythm, and measurement conditions also affect it. Faster pressure generation does not, by itself, show that more blood reaches the systemic circulation.
Preload recruitable stroke work relates work per beat to end-diastolic volume. Measure several beats while changing filling, calculate the work of each beat, and compare it with that beat’s starting volume. The resulting slope describes how much extra work the ventricle produces for each increase in filling volume over the tested range. The horizontal axis uses volume rather than filling pressure.
Glower and colleagues studied this approach in instrumented dogs. They found an approximately linear relationship between stroke work and end-diastolic volume under their experimental conditions. The work helped develop an alternative method of studying myocardial performance, but it did not create a routine fluid target or remove every dependence on experimental conditions. 3
Myocardial strain describes tissue deformation, such as the change in length relative to starting length. It shows how much a region shortens or lengthens. That deformation depends on both muscle activity and the load resisting it. Strain therefore does not directly measure pressure, force, or energy. Regional disease and the acquisition method also affect the result.
The practical approach is to identify what the chosen measurement actually answers. A change in fractional emptying, rate of pressure generation, deformation, and forward output may point in the same direction, but they are not interchangeable observations. Agreement strengthens a physiological explanation; disagreement should prompt examination of loading and technique.
10.8 Pressure–Volume Area and Myocardial Oxygen Consumption
The loop encloses external pressure–volume stroke work. Pressure–volume area, or PVA, is a larger geometric quantity defined within the ventricular elastance model. It adds to the loop an area bounded by the end-systolic relationship, the diastolic relationship, and the relaxation boundary. PVA therefore includes a model component associated with pressure generation that was not converted into external ejection work.
That additional area is conventionally called mechanical potential energy within the model. It is a geometric model quantity, not a direct measurement of a stored energy reserve available for the next beat. The distinction it helps illustrate is important: muscle uses energy to develop pressure even when little blood leaves the ventricle.
Suga related PVA to oxygen consumption in canine ventricular preparations and developed an influential framework for cardiac energetics. The analysis connected external work with the broader mechanical requirements of contraction. 4
Subsequent experiments by Suga and colleagues examined isovolumic and ejecting contractions separately. They found a close relationship between PVA and oxygen consumption per beat in the same ventricle with a stable inotropic background. This is important experimental evidence, but its numerical regression should not be applied as a universal oxygen-consumption formula for critically ill humans. 5
Consider an isovolumic contraction with no ejection. Pressure rises and falls while volume remains nearly constant. The traced path encloses almost no area, so external pressure–volume stroke work is near zero. The muscle still generates tension and handles calcium, using ATP and oxygen. It can therefore have substantial metabolic activity despite doing almost no external ejection work.
Increasing activation can also increase oxygen use beyond the change associated with PVA alone. In canine hearts given epinephrine or calcium, Suga and colleagues found higher oxygen consumption at a comparable PVA. Enhanced activation therefore changed the oxygen requirement as well as mechanical behavior in those experiments. 6
Heart rate adds another dimension because energetic cost occurs repeatedly. A treatment that improves ejection per beat can still increase oxygen demand per minute. Whether that is beneficial depends on the gain in useful circulation and the capacity of the coronary circulation to support it.
10.9 When Disease Removes the Familiar Loop Shape
The usual four-phase diagram assumes that both valves prevent reverse flow when closed. Significant regurgitation violates that assumption. Chamber volume can change during a phase that would otherwise be isovolumic.
In mitral regurgitation, rising left ventricular pressure can drive blood backward into the left atrium before the aortic valve opens. Volume is already falling during what would otherwise be isovolumic contraction. During ejection, blood can leave through both the aorta and the regurgitant mitral pathway. Total chamber ejection can therefore be large while useful aortic flow remains small.
In aortic regurgitation, blood can return from the aorta as ventricular pressure falls. Chamber volume can rise before the mitral valve opens, so the usual isovolumic relaxation segment is lost. Later diastolic filling includes both normal mitral inflow and regurgitant aortic inflow.
Aortic stenosis creates a different problem. Ventricular ejection requires a pressure greater than the pressure measured beyond the stenotic valve. Using the aortic waveform as though it were ventricular pressure can underestimate the chamber's systolic pressure burden and distort a reconstructed loop.
Mechanical support also changes the relationships. A pump may remove blood from the ventricle during intervals when the native valves are closed. Peripheral venoarterial extracorporeal support can change the aortic load against which the native ventricle ejects. The resulting loop depends on the device configuration and its interaction with the patient's heart and circulation.
These examples explain why one should avoid diagnosing a lesion solely from an imagined loop shape. The loop is a representation of measured physiology. Valve imaging, forward-flow measurements, device settings, and pressure information are needed to establish which mechanism is present.
10.10 Measuring Loops and Recognizing Reconstruction Limits
Direct pressure–volume analysis requires synchronized ventricular pressure and volume measurements. High-fidelity pressure sensing captures rapid changes. Volume measurement must track the chamber throughout the beat and be calibrated appropriately.
Baan and colleagues developed a conductance-catheter method for continuous ventricular volume measurement in animals and humans. The technique converts electrical conductance measurements into volume estimates using calibration and correction factors. Their work established an important research method, while also making clear that the measured signal needs interpretation before it becomes a chamber volume. 7
The electrical signal is influenced by blood properties and by current passing through surrounding tissue. Catheter position and chamber geometry also affect it. Calibration and correction are needed before treating conductance as chamber volume. A volume calibration error changes loop width or position. A pressure offset moves the loop vertically and can misrepresent filling pressures.
Pressure and volume must also describe the same instant. If one signal arrives later, the display pairs pressure from one part of the beat with volume from another. A nearly vertical segment can then appear slanted, and the calculated loop area can change. Check timing and calibration before interpreting a reconstructed shape.
Noninvasive approaches usually reconstruct aspects of ventricular behavior using imaging, blood pressure, and assumptions about the pressure waveform or elastance pattern. Chen and colleagues validated a single-beat estimate of Ees using noninvasive measurements. That result supports the specific estimation method studied; it does not mean that ordinary echocardiography directly records a complete invasive pressure–volume loop. 8
For ICU interpretation, ask which signals were measured, which were estimated, and whether they represent the same hemodynamic state. A reconstructed relationship may be useful for research or selected clinical assessment. Its uncertainty should remain visible when treatment, ventilation, and rhythm are changing rapidly.
10.11 Using the Loop as a Bedside Reasoning Tool
Consider an illustrative patient with a dilated left ventricle and persistent hypoperfusion. Initially, end-diastolic volume is 180 mL and end-systolic volume is 120 mL. First calculate total chamber stroke volume:
180 − 120 = 60 mL per beat
Then express it as a fraction of starting volume:
60 ÷ 180 × 100 ≈ 33% ejection fraction
After treatment, measured end-diastolic volume is 170 mL and end-systolic volume is 100 mL:
170 − 100 = 70 mL per beat
70 ÷ 170 × 100 ≈ 41% ejection fraction
The ventricle starts with less blood but ejects more with each beat. Its observed emptying has improved under the new conditions.
That observation supports improved emptying under the new operating conditions. It does not establish whether intrinsic activation improved, arterial load decreased, a regurgitant pathway changed, or several mechanisms occurred together. An actual pressure–volume relationship cannot be reconstructed from the two volume pairs alone.
The bedside assessment therefore examines arterial pressure, rhythm, ventilation, valve function, and forward flow. It also reviews filling pressure or congestion findings where available. A smaller chamber and higher ejection fraction are helpful observations only when connected to the patient's perfusion and loading conditions.
The same improvement in output can accompany different energy requirements. Reducing excessive arterial load may allow more ejection at a lower pressure. Increasing inotropic stimulation may increase ejection while also increasing oxygen use for activation. Ejection fraction alone cannot show which occurred or quantify the change in myocardial oxygen demand.
Pressure–volume reasoning remains useful when no loop is directly measured. Separate the volume available for ejection from the load opposing it. Then assess systolic performance and how much filling pressure rises as volume increases. Connecting these observations helps explain the treatment response and identify what still limits perfusion.
References
1. Suga H, Sagawa K. Instantaneous pressure-volume relationships and their ratio in the excised, supported canine left ventricle. Circ Res. 1974;35(1):117–126. doi:10.1161/01.RES.35.1.117.
2. Tyberg JV, Taichman GC, Smith ER, Douglas NW, Smiseth OA, Keon WJ. The relationship between pericardial pressure and right atrial pressure: an intraoperative study. Circulation. 1986;73(3):428–432. doi:10.1161/01.CIR.73.3.428.
3. Glower DD, Spratt JA, Snow ND, et al. Linearity of the Frank-Starling relationship in the intact heart: the concept of preload recruitable stroke work. Circulation. 1985;71(5):994–1009. doi:10.1161/01.CIR.71.5.994.
4. Suga H. Total mechanical energy of a ventricle model and cardiac oxygen consumption. Am J Physiol. 1979;236(3):H498–H505. doi:10.1152/ajpheart.1979.236.3.H498.
5. Suga H, Hayashi T, Shirahata M. Ventricular systolic pressure-volume area as predictor of cardiac oxygen consumption. Am J Physiol. 1981;240(1):H39–H44. doi:10.1152/ajpheart.1981.240.1.H39.
6. Suga H, Hisano R, Goto Y, Yamada O, Igarashi Y. Effect of positive inotropic agents on the relation between oxygen consumption and systolic pressure volume area in canine left ventricle. Circ Res. 1983;53(3):306–318. doi:10.1161/01.RES.53.3.306.
7. Baan J, van der Velde ET, de Bruin HG, et al. Continuous measurement of left ventricular volume in animals and humans by conductance catheter. Circulation. 1984;70(5):812–823. doi:10.1161/01.CIR.70.5.812.
8. Chen CH, Fetics B, Nevo E, et al. Noninvasive single-beat determination of left ventricular end-systolic elastance in humans. J Am Coll Cardiol. 2001;38(7):2028–2034. doi:10.1016/S0735-1097(01)01651-5.